How the numbers work
Every figure ChemLevel derives, and what it is derived from. Written for the operator who has been asked where a number came from, and for whoever is asking.
Nothing here is estimated from other plants, and there is no model that has to be taken on trust. Every number below comes out of readings your own people logged and settings your own people chose. The same page is inside the app, under Settings → How the numbers work, where it quotes the values your site is actually using.
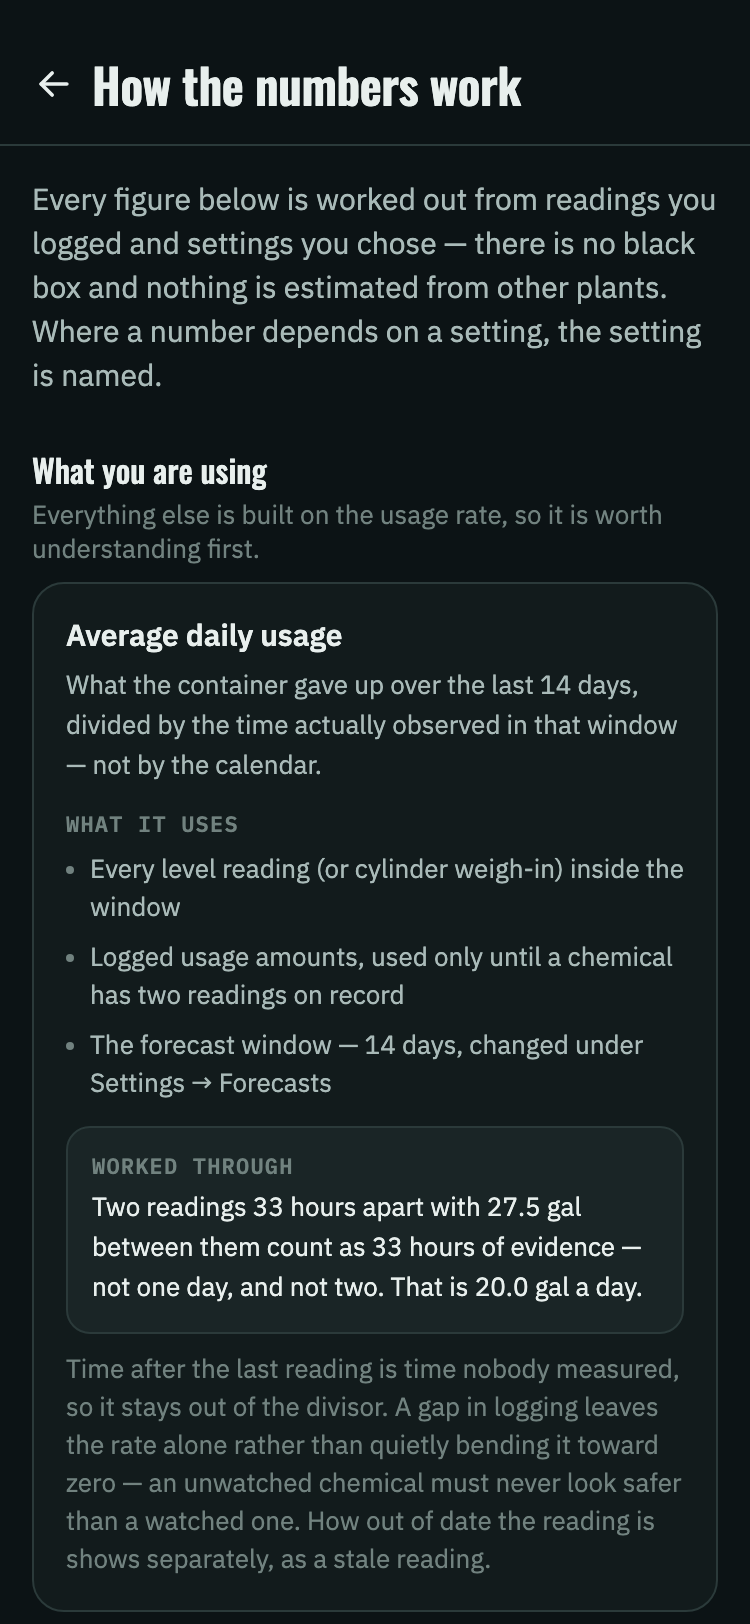
The same thing, in the app
This page is also a screen inside ChemLevel, under Settings → How the numbers work, and beside several figures there is a ? that opens it at the right entry. The difference is that the app quotes the values your plant is using — if you have moved the forecast window off fourteen days, it says so with your number, not the default.
Which is worth knowing if you are standing in front of somebody asking where a figure came from: the answer is two taps away from the figure itself.
1. What you are using
Everything else is built on the usage rate, so it is worth understanding first.
Average daily usage
What the container gave up over the last 14 days, divided by the time actually observed in that window — not by the calendar.
- Every level reading (or cylinder weigh-in) inside the window
- Logged usage amounts, used only until a chemical has two readings on record
- The forecast window — 14 days, changed under Settings → Forecasts
Time after the last reading is time nobody measured, so it stays out of the divisor. So does the stretch between two readings where a delivery landed: the level rose, so what was used across it cannot be read, and counting it would turn a truck into a day of using nothing. A gap in logging leaves the rate alone rather than quietly bending it toward zero — an unwatched chemical must never look safer than a watched one. How out of date the reading is shows separately, as a stale reading.
The level the forecast uses
Where the container is likely to be now: the last measured level, drawn down at the current rate for the hours since it was measured.
- The last reading and when it was taken
- Average daily usage
The level the screen shows stays the measured one — inventing a displayed number nobody read would be worse than showing a real one clearly marked stale. Only the forecast projects forward, and it never projects below empty.
Unusual usage
The last 3 days' rate against the 14 days ending 3 days ago, flagged when the two differ by more than 35%.
- Level readings across both periods
- The threshold — 35%, changed under Settings → Forecasts
It needs roughly 17 days of history before it will say anything at all. It reports a change in pace, not a shortage — how much is left is the status color’s job, and the two move independently.
Stale reading
A chemical is marked low-confidence once its last reading is more than 36 hours old.
- The time of the most recent reading
The forecast keeps running on the rate it already has. The flag is about how much weight to put on it, not a claim that the number is wrong.
2. When you will need more
Runway, the point at which ordering can no longer wait, and the dates that follow from it.
Days until empty
The projected level now, divided by average daily usage.
- The level the forecast uses
- Average daily usage
It assumes today’s rate holds. It is a runway, not a promise — a process change moves it the moment the next reading lands.
Reorder point
How much runway you want still in hand when the order goes out: supplier lead time plus safety stock, unless a number of days has been set directly.
- Supplier lead time, on the chemical’s configuration
- Safety stock days, likewise
- Or a reorder point in days, which overrides both
Days until reorder, and the order-by date
Days until the projected level reaches the order-by level set on the gauge — or, where no such level is set, days until empty less the reorder point.
- An order-by level, if one is configured
- The level the forecast uses
- Average daily usage
- The reorder point
A physical order-by level wins wherever one is set: it predicts the threshold actually marked on the gauge rather than an abstract day count. The order-by date then works back from the delivery day, so it can be earlier than the raw day count implies.
Next delivery date
The first day a truck can actually come, on or after the date the chemical needs it.
- The days deliveries are accepted, under Settings → Delivery Info
- Supplier lead time
- Days until reorder
With no delivery days configured, every day counts as available. An order-by date already in the past is shown as today rather than backdated — it needs placing now, not explaining away.
3. The color on the card
One rule, applied the same way to every chemical and every rack.
Green, yellow and red
Red once the reorder point has been reached or passed. Yellow inside the last half of it. Green everywhere before that.
- Days until reorder
- The reorder point
The band scales with the reorder point, so a chemical on a three-week lead time gets proportionally more warning than one that arrives next day. Red does not mean empty — it means the order can no longer safely wait.
4. What to order
The quantity proposed, and the orders still expected before the year is out.
Recommended order quantity
Your standard load, capped at the space actually left in the tank.
- The standard or full load size on the chemical
- Tank capacity
- The current volume
The cap is the point: no delivery can be proposed that would overflow the tank. With no load size on file the headroom is the recommendation. The figure is rounded to a sensible ordering quantity before it is shown.
Orders projected to year end
The container is run forward at its current rate to the end of your budget year, placing an order each time it reaches its reorder point. A cylinder rack is run forward one swap at a time, the same way its spare trigger is, so the spares on each row are whole cylinders. Where a year of past usage is on file, the rows past the next month follow last year’s pattern instead of today’s rate. An order already placed is counted on its delivery date instead of a projected one. One placed as a full load counts as your full load size as it is set now, so correcting that figure corrects the orders already out.
- Average daily usage
- The recommended order quantity
- The reorder point
- Your budget year start
- Delivery days
- Orders already placed
Where there is not enough on file to run the container forward, it falls back to how often deliveries have actually been arriving. Either way the dates move as usage does — a hot week pulls every one of them in.
5. Cylinders
Racks are counted in bottles and swaps rather than volume, so several figures are their own thing.
Duty, standby and empty
A position reads empty at or below 5% of a full cylinder. Above that it is on duty if it has given anything up in the last 3 days, and on standby if it has not.
- The latest weigh-in for each position
- The full weight of a cylinder
- Consumption over the last few days
Empty is checked first: a bottle that has just run out has both a near-zero weight and recent consumption, and it is the weight that tells you what to do about it. 3 days rather than one interval, so a quiet night on a plant that batch-doses does not flip a working cylinder to standby and back.
Days until changeover
When the cylinder now on duty reaches empty, from its own weigh-ins and the rate it is being drawn at.
- Weigh-ins for the duty position
- The rack’s usage rate
- The full weight of a cylinder
Each position is forecast from its own history, so a rack part-way through a bottle does not get the average of the whole rack applied to it.
Days until the spares run low
How long until the spare stack falls to the number you said to order at, counted one swap at a time.
- Spare cylinders on hand
- The order-by number of spares
- When each cylinder on the rack is due to be swapped
- The rack’s usage rate
Swaps that the weigh-ins can date are used as measured; past those the rack is running on bottles that arrived full, so the remainder is spaced at one cylinder’s worth of gas each. Spares are a single shared stack — the reorder math deliberately does not split them by what they are for.
6. Money
Spend so far, where it should be by now, and where it lands — three different questions.
Spend so far
What the deliveries logged inside the current budget year cost, plus anything recorded as spent before tracking began.
- Logged deliveries and their costs
- Your budget year start
- Spend carried in from before the app was tracking
It counts deliveries, not orders — a load ordered and not yet arrived is not spend. That is what keeps this figure reconcilable against invoices.
Expected by now
The annual budget spread evenly across the budget year and taken up to today.
- The annual budget for the chemical
- Your budget year start
- Today’s date
A straight line, deliberately. It describes the past and nothing else, and a chemical whose deliveries cluster early will read over it while still finishing the year comfortably under.
Projected year end
Spend so far, plus what the orders still expected this year are likely to cost.
- Spend so far
- Orders projected to year end
- What this chemical’s recent deliveries have actually cost
- Last year’s pattern, where there is one
Prices come from your own invoices, weighted toward recent ones so a price rise shows up rather than being averaged away against last year. Where a chemical has no delivery history to price from, the figure is spend so far and is labeled as such — it then answers "have you already gone over", not "are you heading over".
Following last year’s pattern
Past the next month, usage follows how last year moved from this time of year on, at this year’s level, so a busy summer and a quiet winter are both in the projection.
- Past deliveries, pasted in under Settings → Budget Year
- ChemLevel’s own readings, once they reach back a year
- Average daily usage
The next month always runs at today’s rate, and last year eases in over the month after that. Each past delivery is spread across the days since the one before it, because a truck replaces what went out since the last one. Where too little of last year is known, the projection stays at today’s usage. When the two year-end figures differ by 10% or more, both are shown.
The color on a budget
It keys on the projected year end, not the pace: green under budget, yellow in the narrow band just over, red clearly over.
- Projected year end
- The annual budget
This is why a chemical can be running ahead of pace and still be green. Pace is a description of the past; the color is a claim about the end of the year, and the end of the year is the question a budget actually asks.
The forecast window and the unusual-usage threshold are per-site settings, so a plant that has changed them will see its own values quoted inside the app. Everything else above is the same everywhere.